Nonstationary Extreme Rainfall Risk Under Climate Change
Per-cell Bayesian EVA of North Atlantic tropical-cyclone rainfall across 3,394 cells, comparing 17 stationary/nonstationary family–formulation specs under threshold-weighted CRPS.
Per-cell 0.25° Bayesian extreme-value analysis of tropical-cyclone rainfall across the North Atlantic basin (3,394 land+ocean cells, ~35 years of storm-level data). The goal is defensible intensity–duration–frequency curves that acknowledge climate nonstationarity rather than assuming stationary behavior.
Model survey
A 17-effective family–formulation grid (7 distributions {stationary, time-only, time + PI + ONI + TCWV + TS}) is fit to each cell’s annual total rainfall series. Selection uses threshold-weighted CRPS under leave-one-out CV, gated per-cell on fold coverage and compared against a stationary-GEV baseline.
Current findings
When stationary and nonstationary families compete under a 90th-percentile twCRPS score, stationary winners dominate (~82% of cells) and the modeled mean-trend map visibly undershoots the observed Sen-slope pattern. Restricting the selector to nonstationary families reproduces the raw trend pattern, lifts basin-median QQ correlation from to , and surfaces generalized gamma and gamma as the dominant families — GEV shrinks to ~10% of cells.
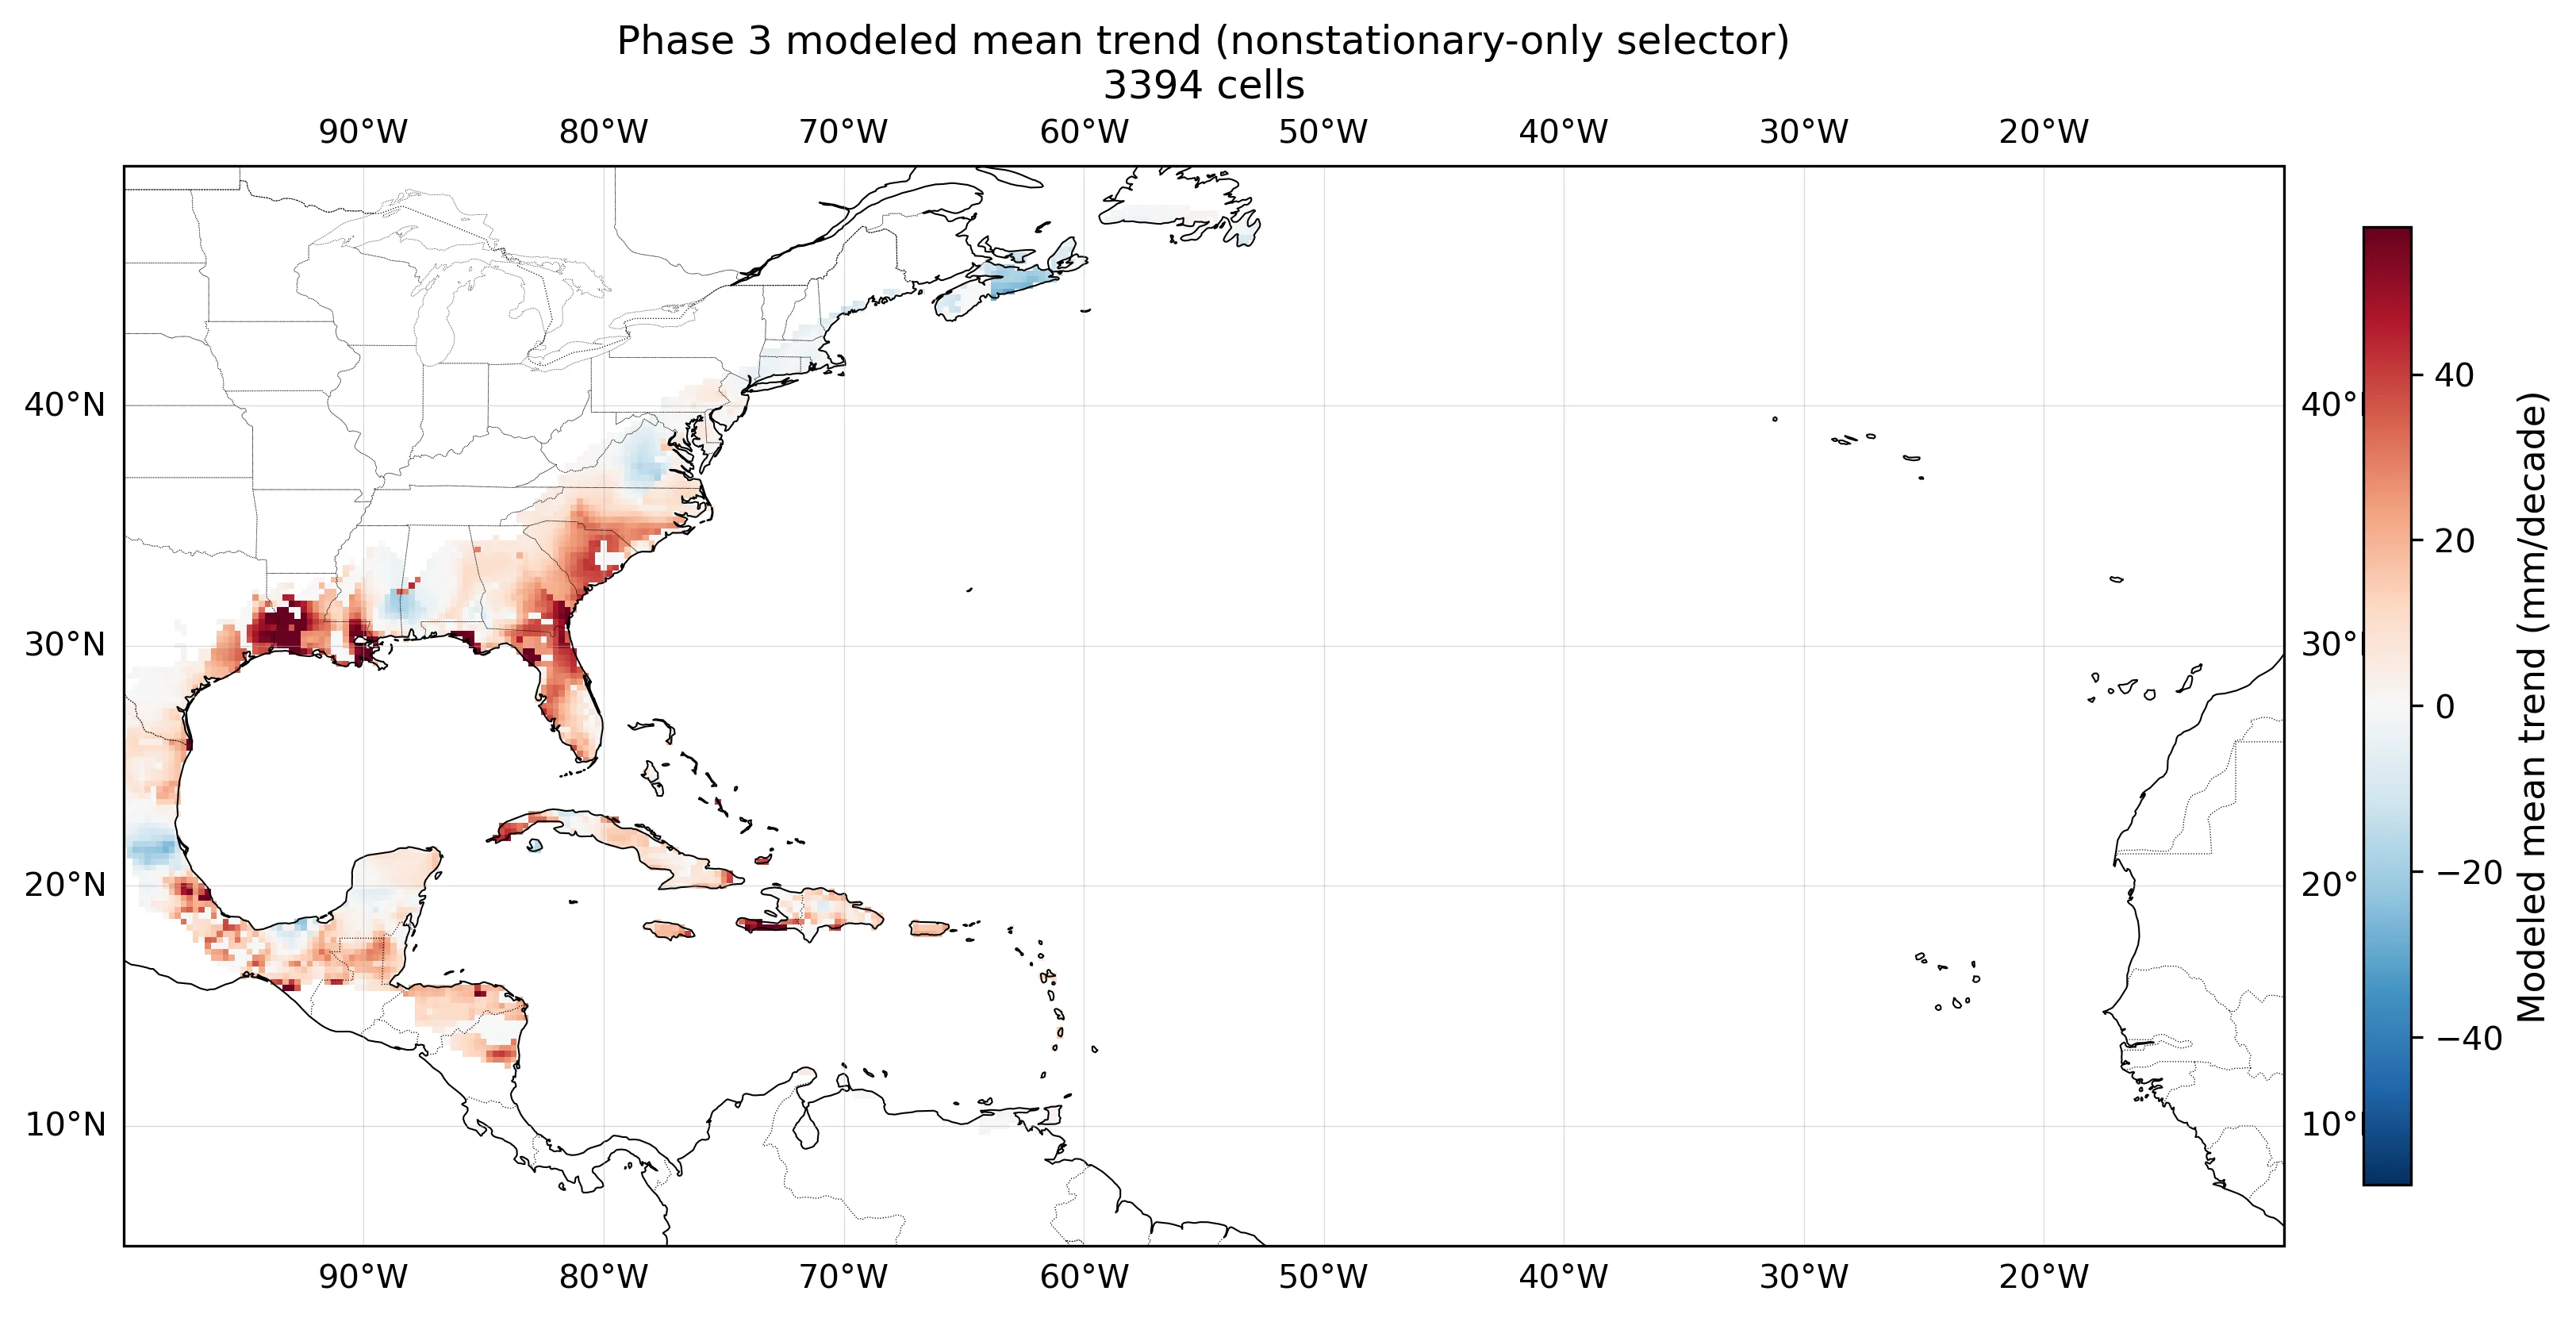 Modeled mean-rainfall trend per cell (mm/decade), nonstationary-only selector.
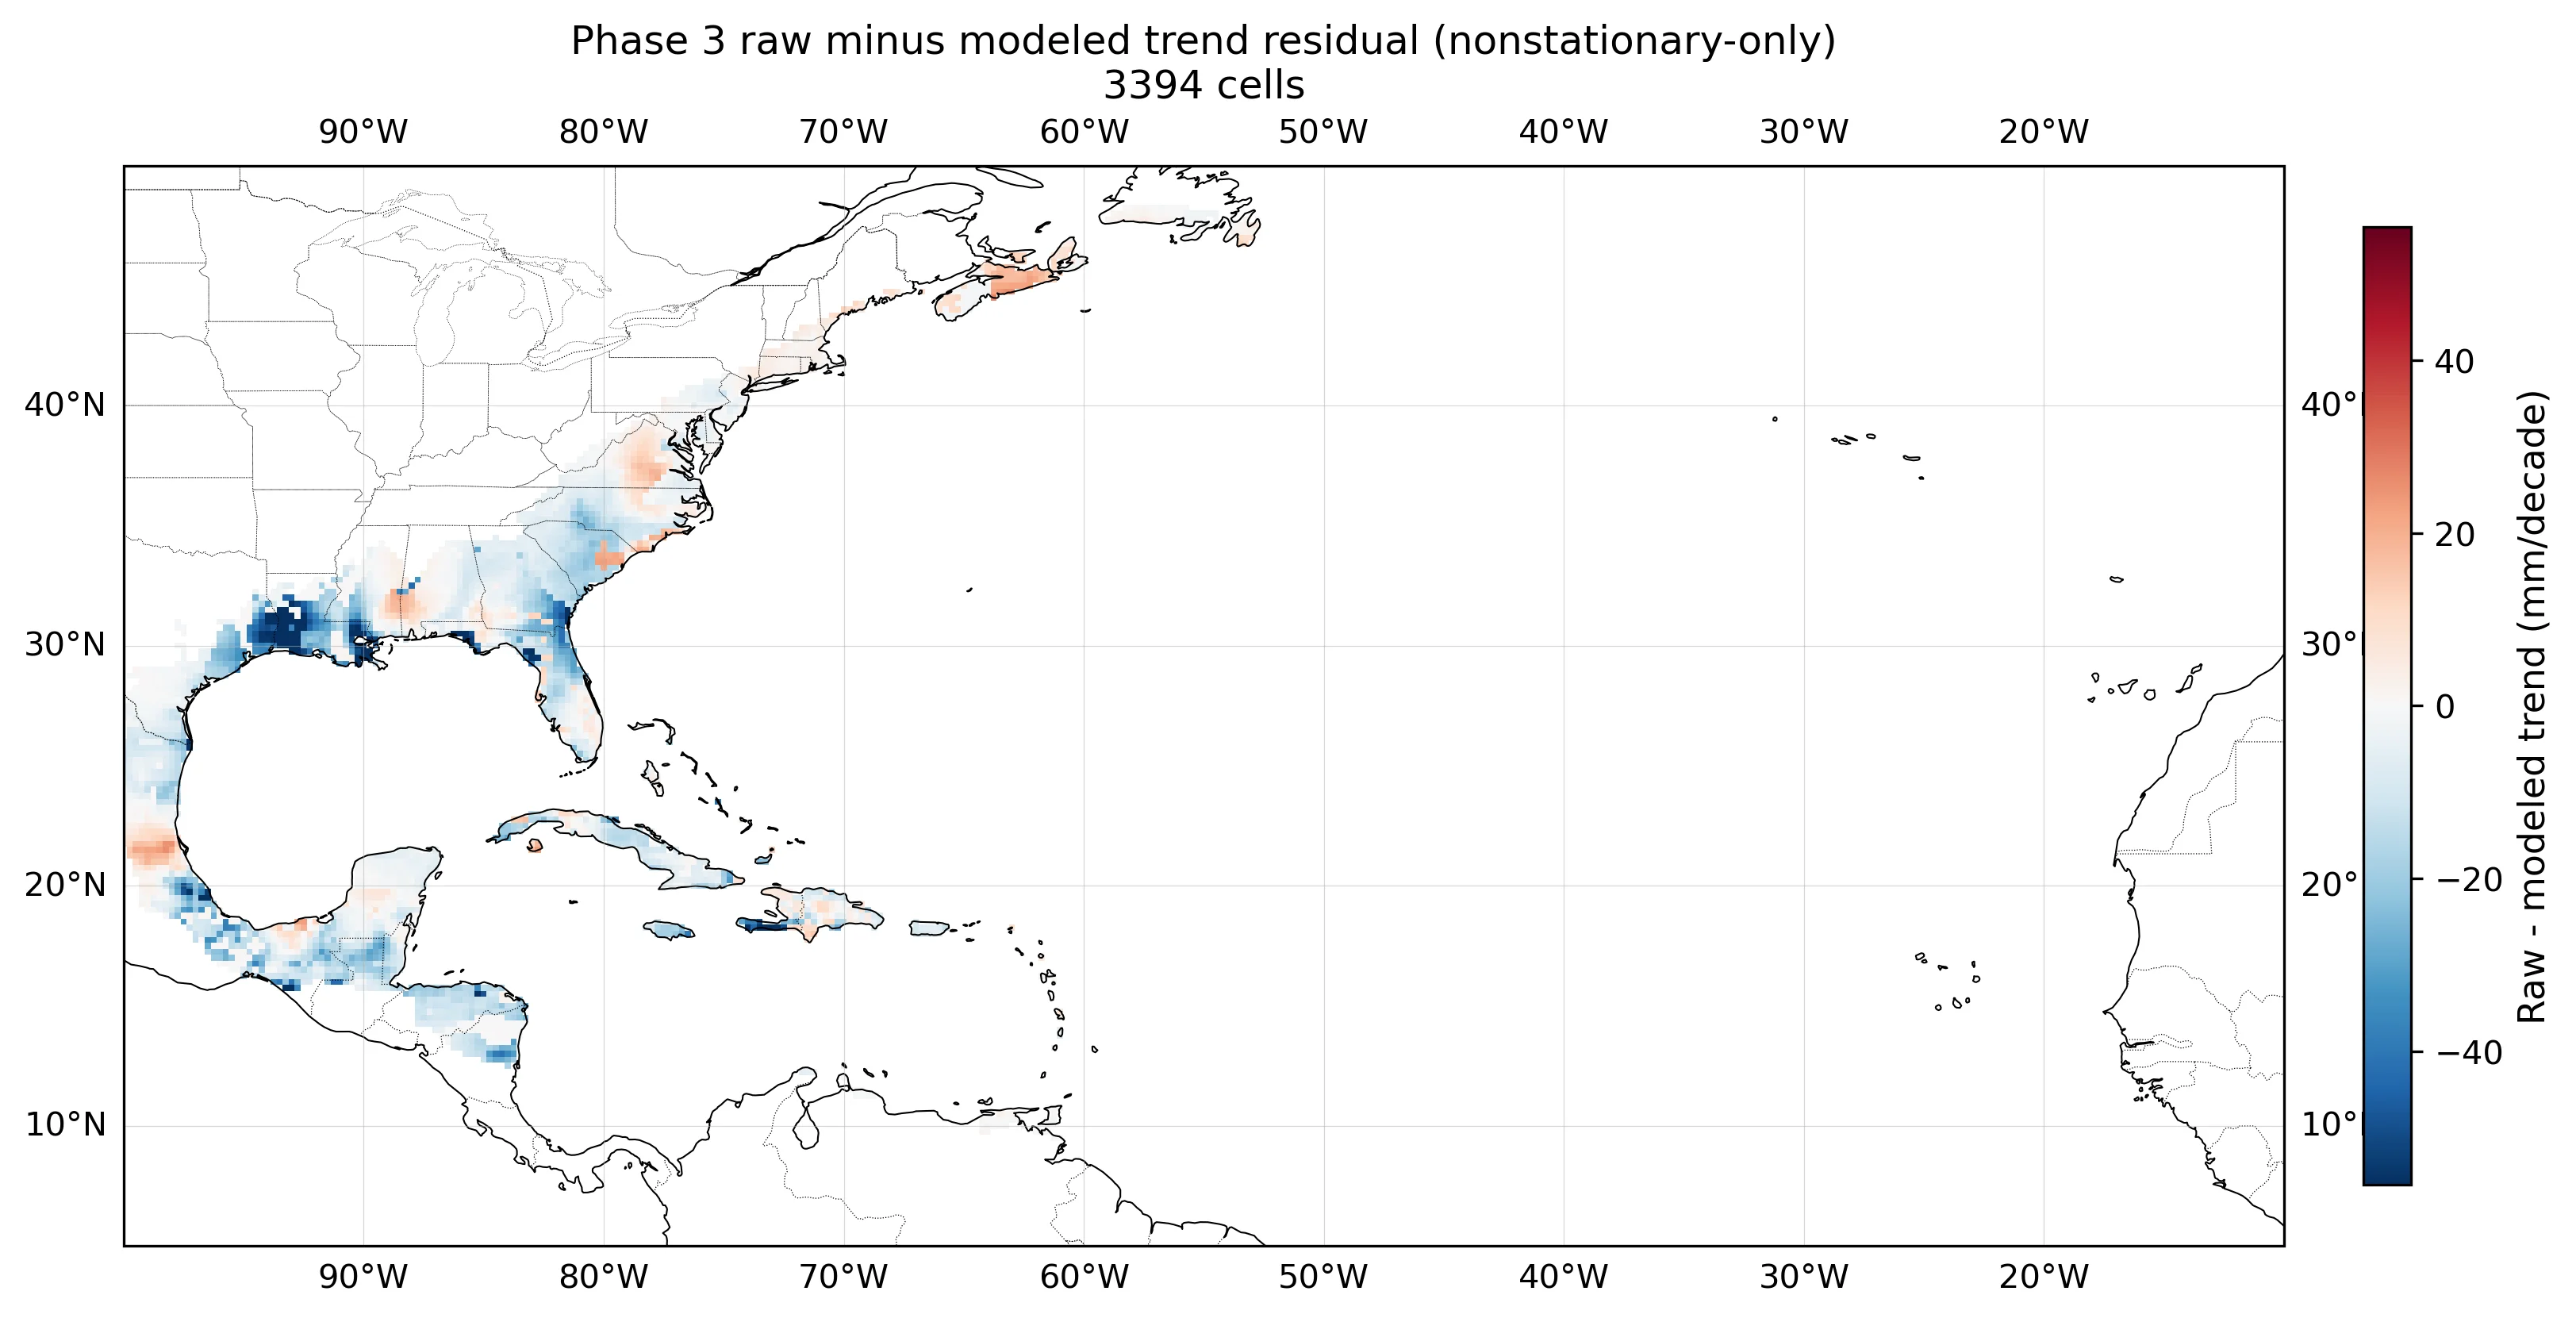 Raw Sen-slope minus modeled trend. Near-zero residuals across the basin show the model reproduces the observed trend pattern.
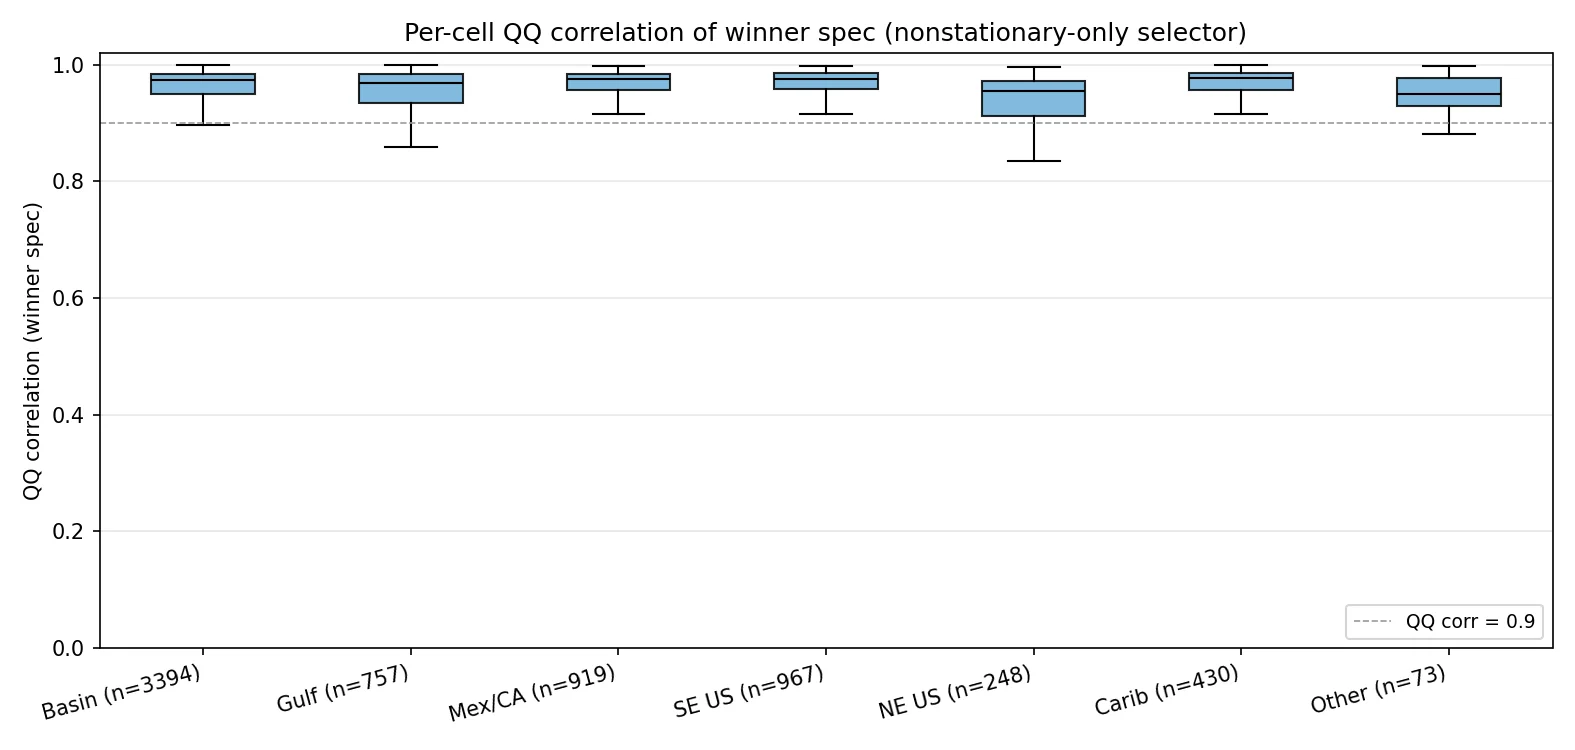 Per-cell QQ correlation of the upper-half fit vs observed return levels, by subregion. Basin median .
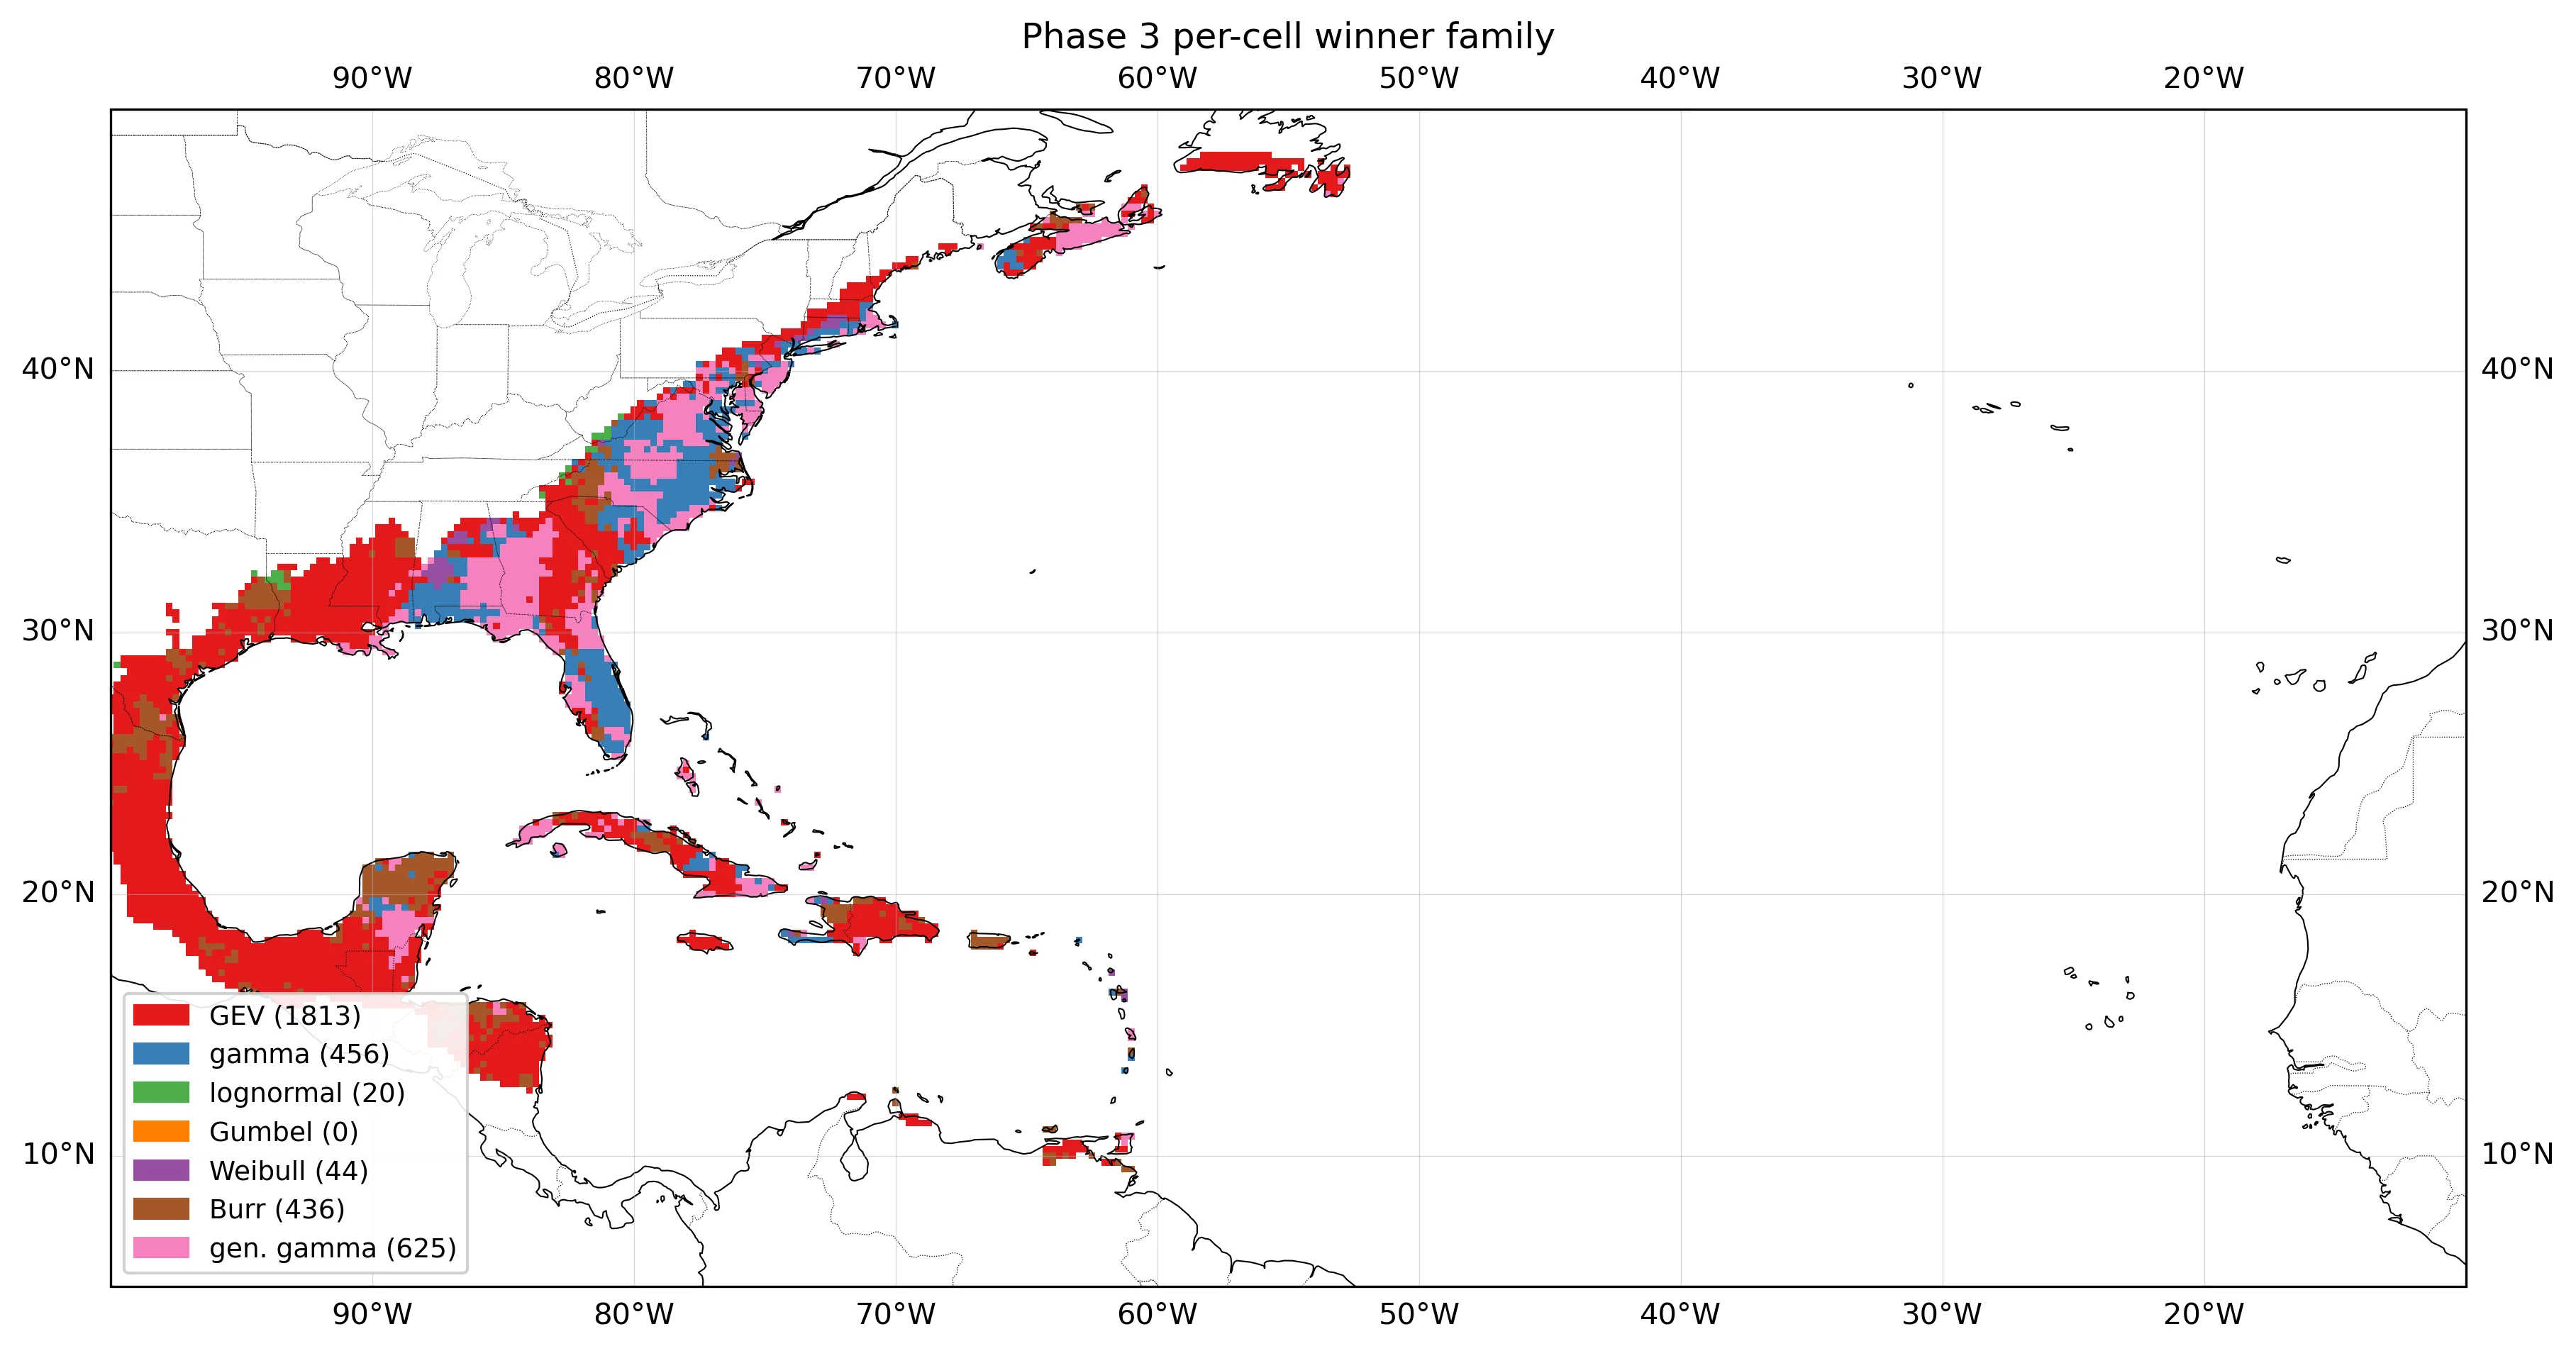 Selected distribution per cell under the nonstationary-only selector. Generalized gamma and gamma dominate; GEV is rare.